This page is an analysis after using Whoop to track sleep, strain, stress, and numerous other biometrics
At the time of writing this, I have used the Whoop sensor for 1,340 (3.67 yrs) days in succession.
There are some gaps in time when the sensor was dead, malfunctioning, not charged, or in a location without power for an extended period.
The design allows one to easily leave the sensor on the wrist for as long as possible. The most important factor here is that it charges using a removable battery pack. The sensor is also waterproof.
The mobile app is dense and deep, sometimes requiring a significant amount of time to read metrics. Overall, the app’s design is well thought out. Recent updates with Plans can help the user implement some actions instead of passively gathering data.
The cost is surprisingly high, and I have not yet justified it, even after 4 years. There are consistent and regular improvements to the Android app and firmware, which is the main reason for keeping the subscription.
Even though this is subscription based ( who needs more?), I commend the company for providing users with newly released hardware. This is probably the biggest perk of Whoop’s model.
Quantified Self is about using modern tools to gather information that can be potentially actionable, which in turn has the opportunity to improve your life. It’s not necessarily about expensive sensors and complicated apps but about gathering data, testing, and applying changes. These are all preceded by an idea: “What can I do to improve my life?”
If you are like me and wonder about the effects of caffeine and nicotine on sleep and performance, adherence to sleep cycles, supplementing, maintaining a circadian rhythm, ability to recover after a workout, effects of breathwork and meditation, etc, then this is a worthwhile practice. There are numerous questions I have. There is a trap here: adopting protocols that are said to be “magic bullets” or “cheats.” Whichever platform you choose to measure biometrics, use that data to do what is right for you. Be willing to make changes and adopt new protocols, but not at the expense of your enjoyment of the process.
Technically speaking, this can be an empirical study using techniques like linear regression, k-means, anomaly detection, factor analysis, etc. Essentially, the majority of people do not use these techniques manually but view the products of their analysis downstream in applications that visualize trends, anomalies, and predictive outcomes. All of this is not entirely necessary to implement the practice of QS. You could simply use paper and pen to keep a log of how you feel when you wake up and note what your activities were the night before. Over time, you could extrapolate how certain activities might affect mood in the morning. The way you measure should be determined by what you can habitually maintain and is low friction in terms of your available bandwidth.
It’s easy to fall into an obsession with data collection and shove off the analysis and interpretation stage. While many applications can help with this, it doesn’t naturally push the average user into understanding the methods used to interpret the data. Instead, companies have integrated gamification, to tap into the competitive nature of society and our obsession with accolades. In many instances, the reward system does produce the intended effect of increased engagement and longer-term play. Although, for myself, I do not care much about the award system.
I first saw this product in a video; the details I can’t recall, and I thought it was just another Fitbit-type device. I have long been interested in QS as a practice, especially as it pertains to the quality of my sleep. My struggle with it has revealed many notable negative effects in my life overall. A Whoop is primarily a wrist-worn sensor that consists of an optical heart rate sensor that uses green leds and photodiodes to capture blood volume under the skin, which measures heart rate and heart rate variability (hrv). The newest version, which I have been using for almost two years, uses additional red and infrared leds, a skin temperature sensor, and a pulse oximeter for measuring blood oxygen saturation (SpO2). Via Bluetooth, it transmits data to the Whoop App. There is also a web app, but it’s clunky and only has a few features.
Since the sensor is always working, I figured it would be the best option to get a comprehensive look of general biometrics over time. I started with the 3.0 version, but shortly after the beginning of my subscription, I was upgraded to the 4.0, which is what I used to gather most of my data. The price was a bit hard to swallow, and I lamented being required to sign up for a subscription. On the positive side, signing up for the 12-month plan reduced the cost to about $18 per month.
Wearing the sensor, after this long, has become an afterthought. It’s so light and compact that it’s easy to forget you have it on (or put it back on). The straps are thin, stretchable, and quick drying. Recently, I opted for their acquatic band that is slightly thicker and softer. My opinions on the subscription cost also reflect the same sentiment on the cost of their accessories (straps, sleeves, etc). So, I’ve only purchased one additional strap since I began. I should also note that during workouts, I don’t notice it on either, and a plus is that the sensor auto-detects activities.
I’ve had a backlog of questions and tests I have wanted to run for years. Other than wanting to be informed, I also enjoy extrapolating questions and answers from data. Especially data that can improve performance and general health. Here are some early test ideas I wrote down:
Initial goal: track consistent sleep to generate a long-term profile of sleep habits and any negative environmental or personal effects that hinder sleep quality
Questions:
how does caffeine affect my sleep?
what time should I stop using caffeine?
what is the effect of Nicotine on sleep, and how much should I use?
how many times do I wake up at night?
how much does sleeping with pets in the same room affect my sleep?
does reading before bed reduce the time from wake to sleep?
Measurements:
measure negative effect of nicotine on daily performance and sleep
measure the effect of a difficult workout on next-day recovery
analyze sleep results after implementing a bedtime routine (eg. reading, red-light, low-light, cool room)
measure the effects of taking the sleep stack (Mg Threonate, Theanine, Apigenin)
After years of use, even to this day, the costs are still hard to justify. Again, the free upgrades given upon release of a new generation are a major benefit, but as a whole, it’s an investment. Even so, I have not consciously looked for excuses to end the subscription, but after being a long-time user, I feel that I have some grounds for complaint.
For the 24-month membership, upfront costs are 399,andtheannualis239. There is also a monthly subscription, which is 30permonth(360/yr), which is the plan I am currently on. It would make sense to shift over to at least the yearly, but it seems that I am not thrilled about the idea of receiving a $240 bill at the beginning of each year. Upon initial order, their standard band is included, which is what I chose. (Note: the membership is hsa / fsa eligible, which I did not know until very recently)
Whoop gathers metrics from a wrist-worn sensor via an optical sensor that produces green light and photodiodes that measure the reflected light changes from blood flow. The 4.0 is the result of some reconfigurations of the sensors and some additions that include four photodiodes (light sensors), three green leds, infrared, and one red led. There was a 33% reduction in size from the previous model while introducing more components on the pcb, which can measure SpO2 and skin temperature. Whoop boasts that they built the first product in the world to be powered by Sila’s silicon-anode chemistry, which allows for a smaller form factor battery with a 17% higher energy density.
Measuring SpO2 involves a process called pulse oximetry, where the O2 level of your blood is measured as a percentage (O2 saturation). The inline leds shine in two different wavelengths of light through the skin to illuminate the blood vessels. Then, the light is reflected back to the photodiodes. The two wavelength frequencies are separately set to measure oxygenated hemoglobin and non-oxygenated hemoglobin, respectively. The same set of sensors can also measure live heart rate, hrv, resting heart rate, and respiratory rate.
The unit itself is very lightweight at 11.3 grams, does not contain a screen, and is slightly smaller than the width of my wrist. The clasp and strap design allows you to change or take off the band without having to rethread it.
The newer battery design allows for charging while immersed in water and is still slideable onto the unit. The difference here is the contactless design of the charging mechanism. Instead of using electromagnetic contacts, the pack charges by connecting wirelessly to the sensor and has an IP68 rating (immersion beyond 1 meter) for dust proofness and water resistance.
Home view of the Android App that shows the major metric highlights with analysis from sleep the night before. Recovery, rhr, and hrv are updated as soon as sleep is auto-processed after waking up. These are the metrics on which the rest of your day is meant to be based. The Health Monitor opens up to reveal 5 metrics, and the stress monitor shows trends over a few periods. Daily outlook is an AI-generated text output in a chat window that summarizes the starting metrics post-sleep analysis and what activities are optimal based on calculated recovery percentage. Activities can be started here, or if an activity has already been completed, it can be added. Selecting the sleep activity brings you to the main sleep analysis page.
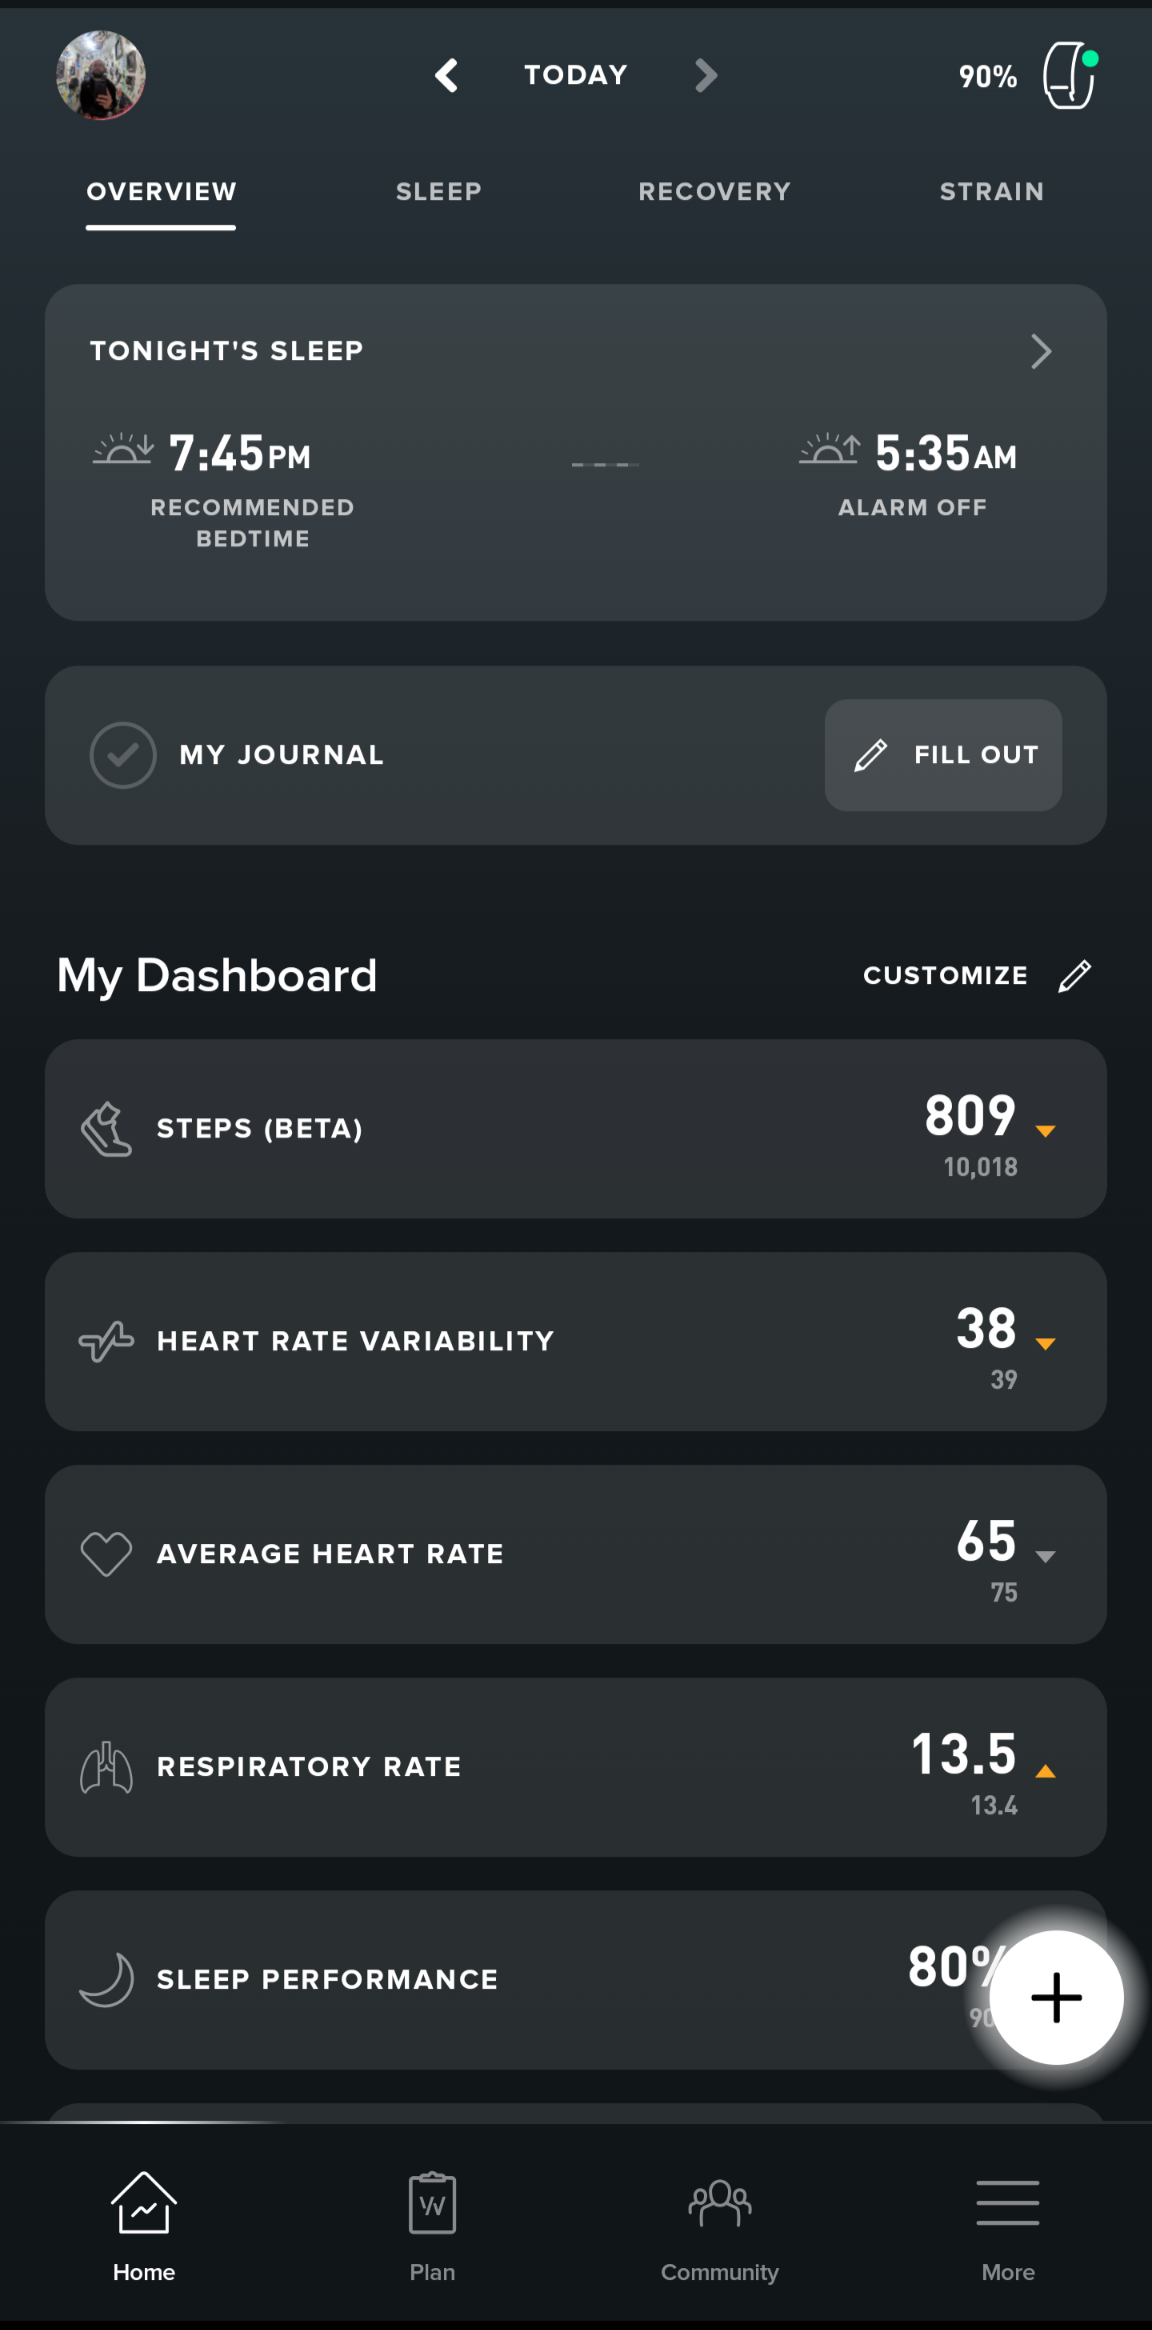
The section for Tonight’s Sleep gives you a proposed bedtime based on your previous night’s sleep and recovery percentage. ‘'My Journal'' section opens up the previous day’s journal entry to add selections from a set list that adds supplemental data for future metrics. My Dashboard is a user-customized list of high-level metrics that are decided as most important and can give a general overview without the need to click into more detail.
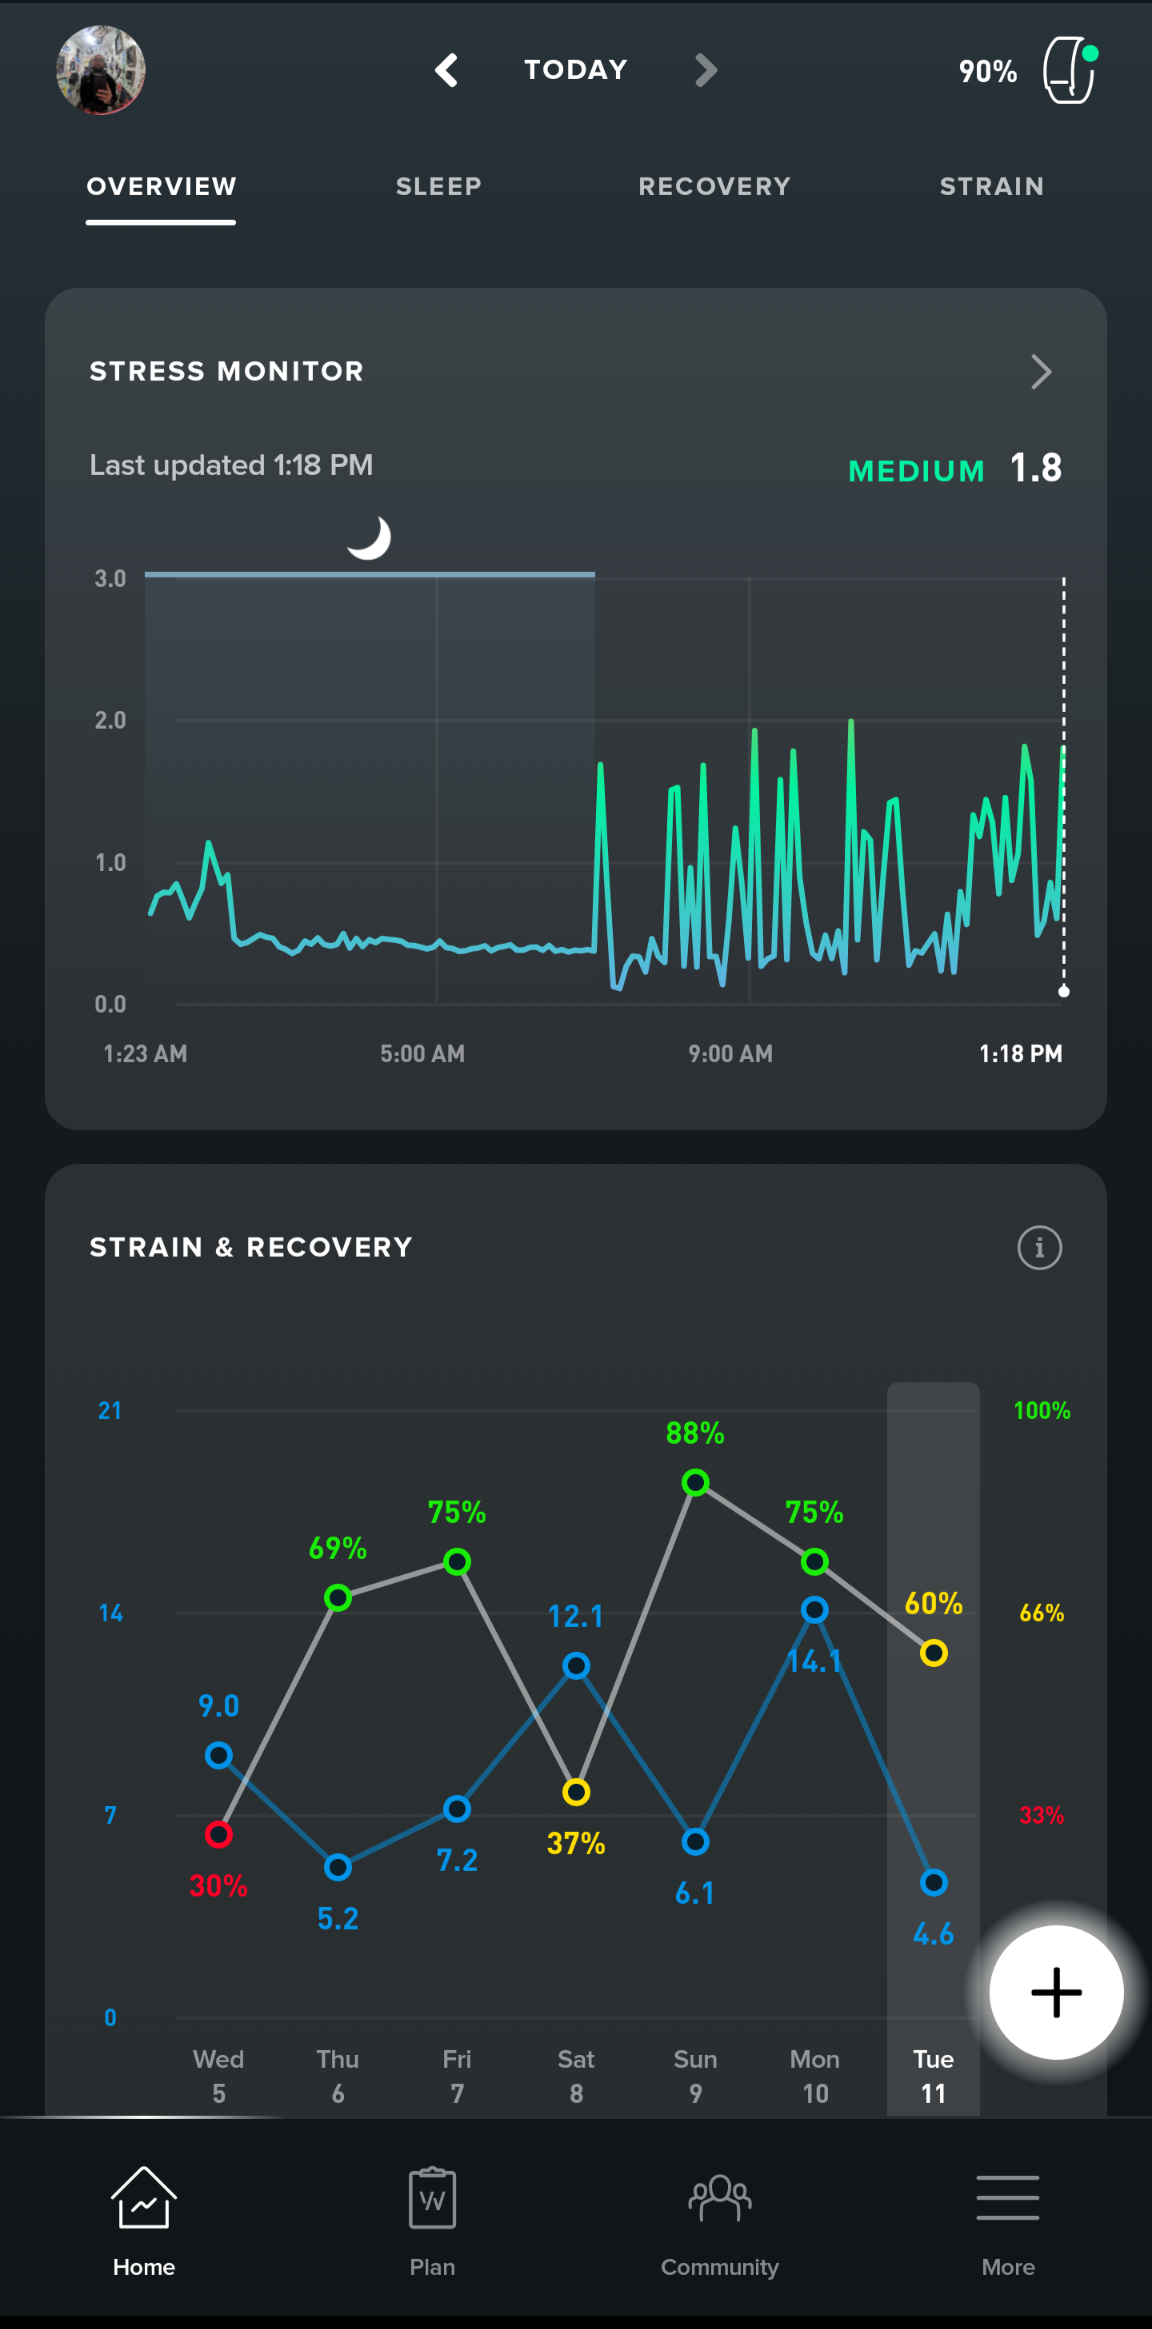
Stress Monitor displays a line graph covering the entire previous day where levels of stress are measured over time. Strain and Recovery displays a line plot for the current day and the previous 6 days of the calculated recovery percentage. This gives a good overview of a possible trending decline (or incline) in recovery.
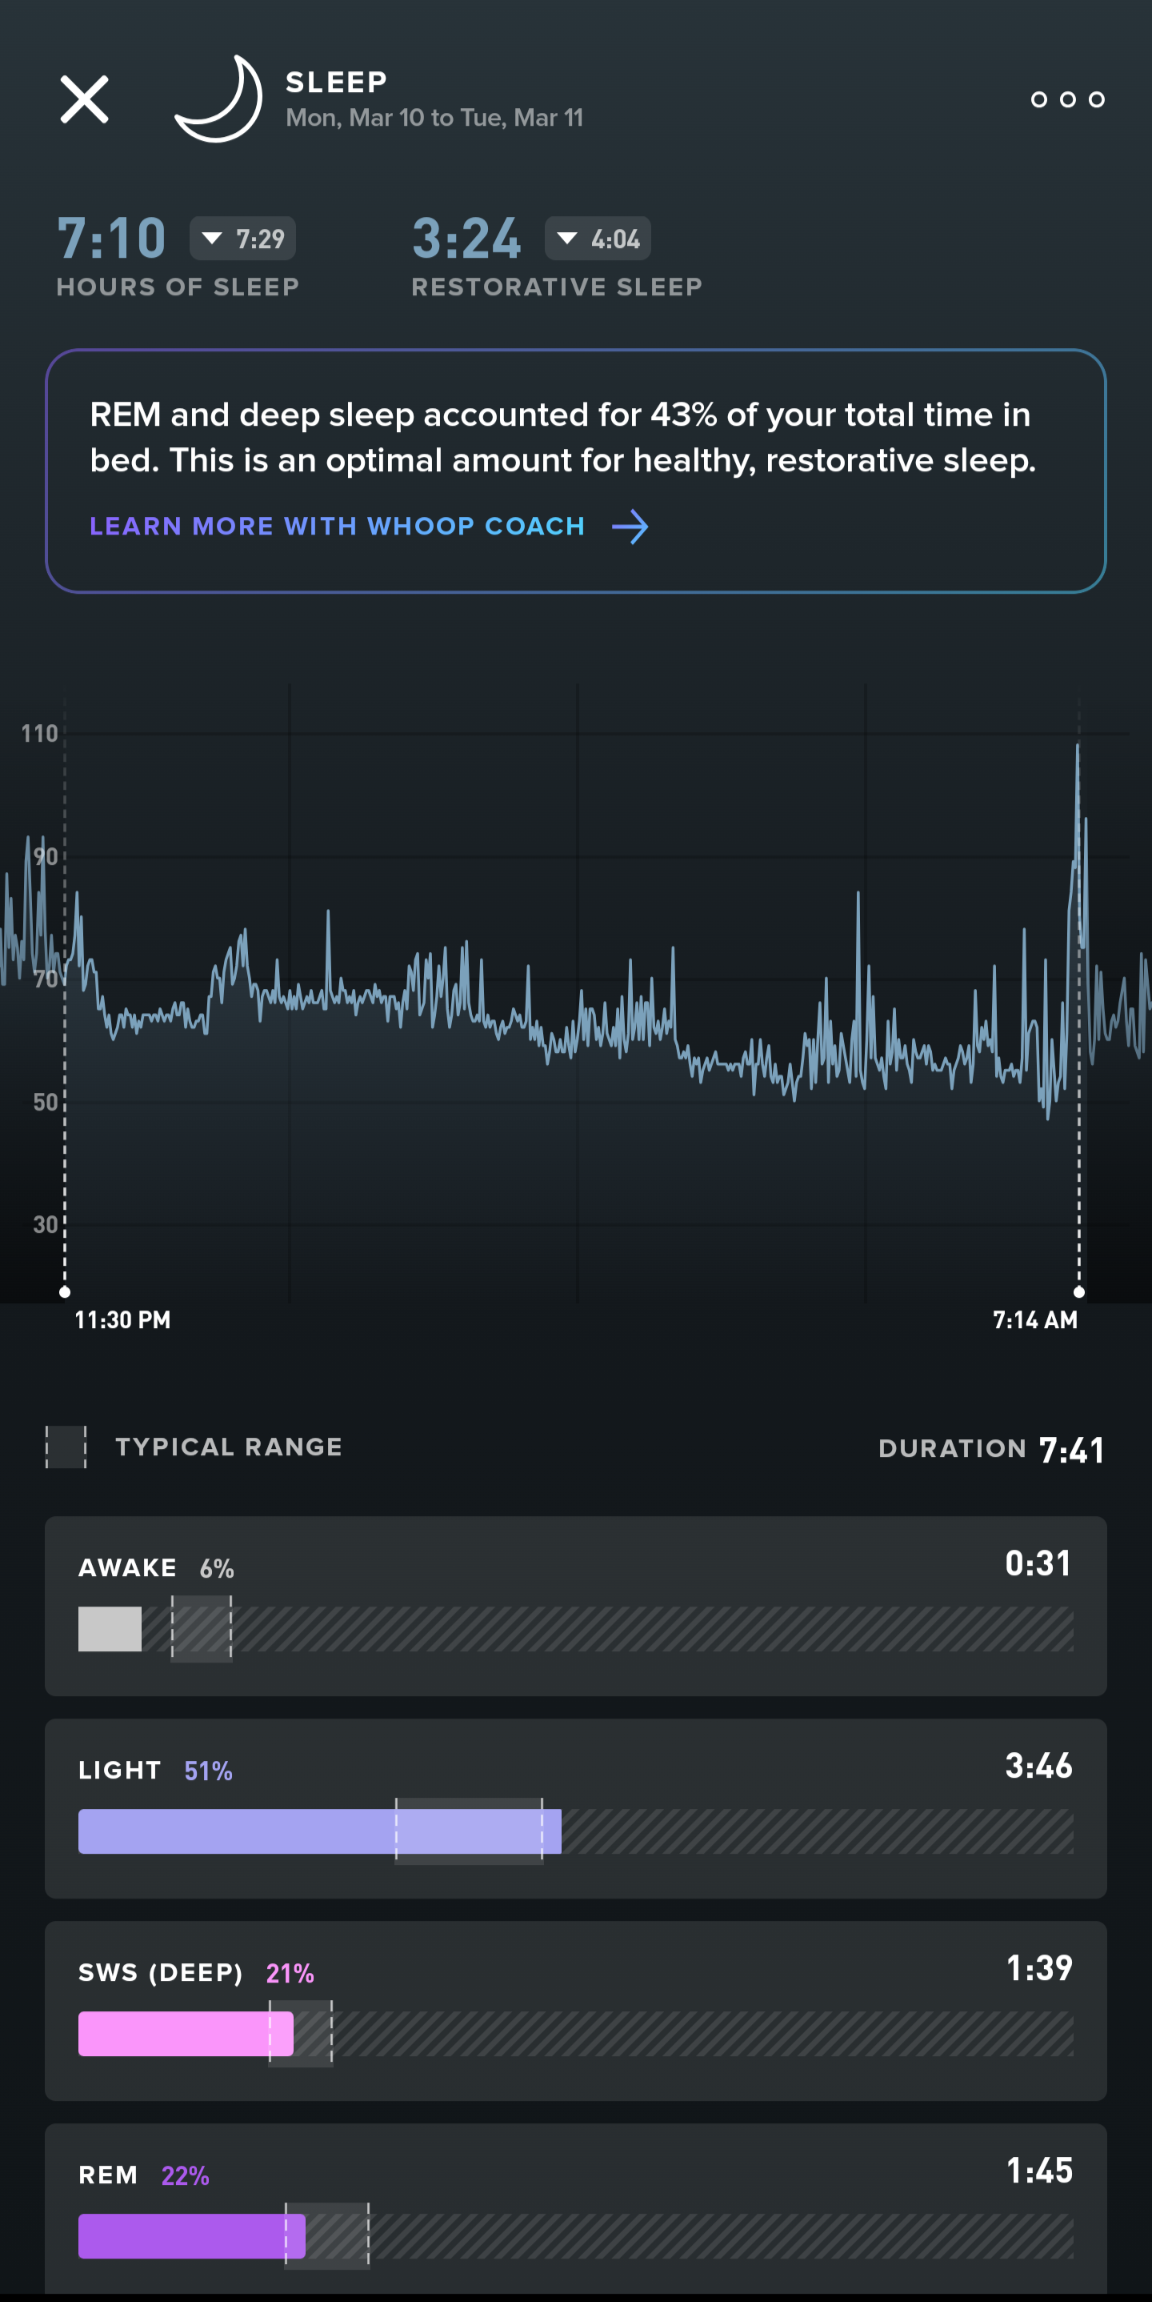
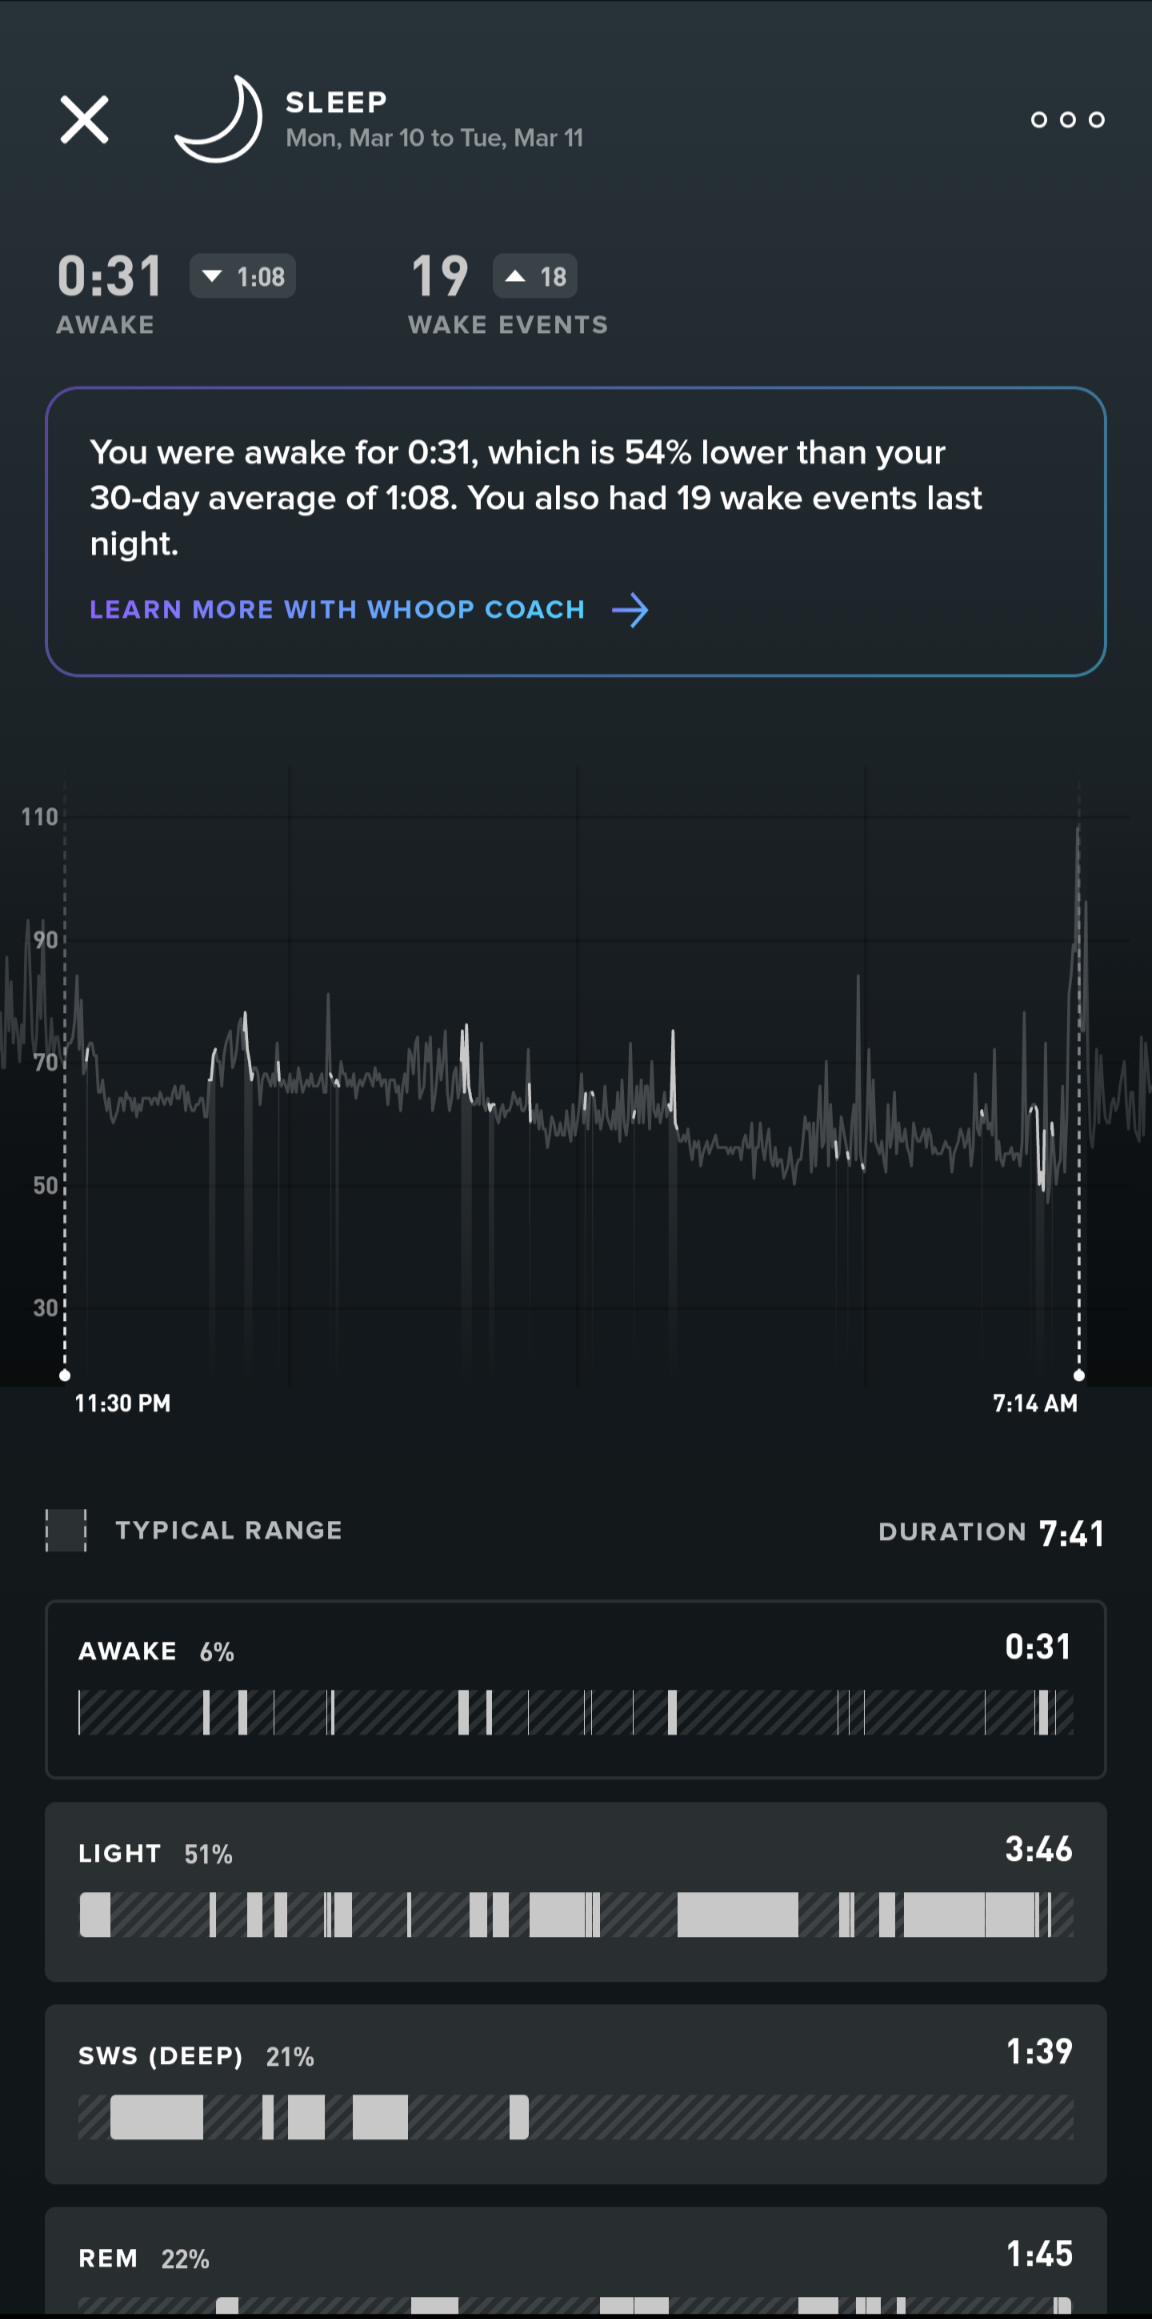
Selecting Sleep in the Activities pane brings up the calculated sleep from the previous night, breaking it down between hours of sleep and restorative sleep at the top. The graph in the middle shows bpms for the calculated duration of the sleep activity. The bars below are self-explanatory, breaking down calculated sleep by awake, light, sws, and rem cycles. They are clickable and explode out to show where in the calculated sleep the specific sleep cycle happened.
In the sleep graph, the Awake metric is split out from the heart rate metric in the total calculated sleep, measuring wake events, effects on the 30-day average, and duration of time awake during the previous night.
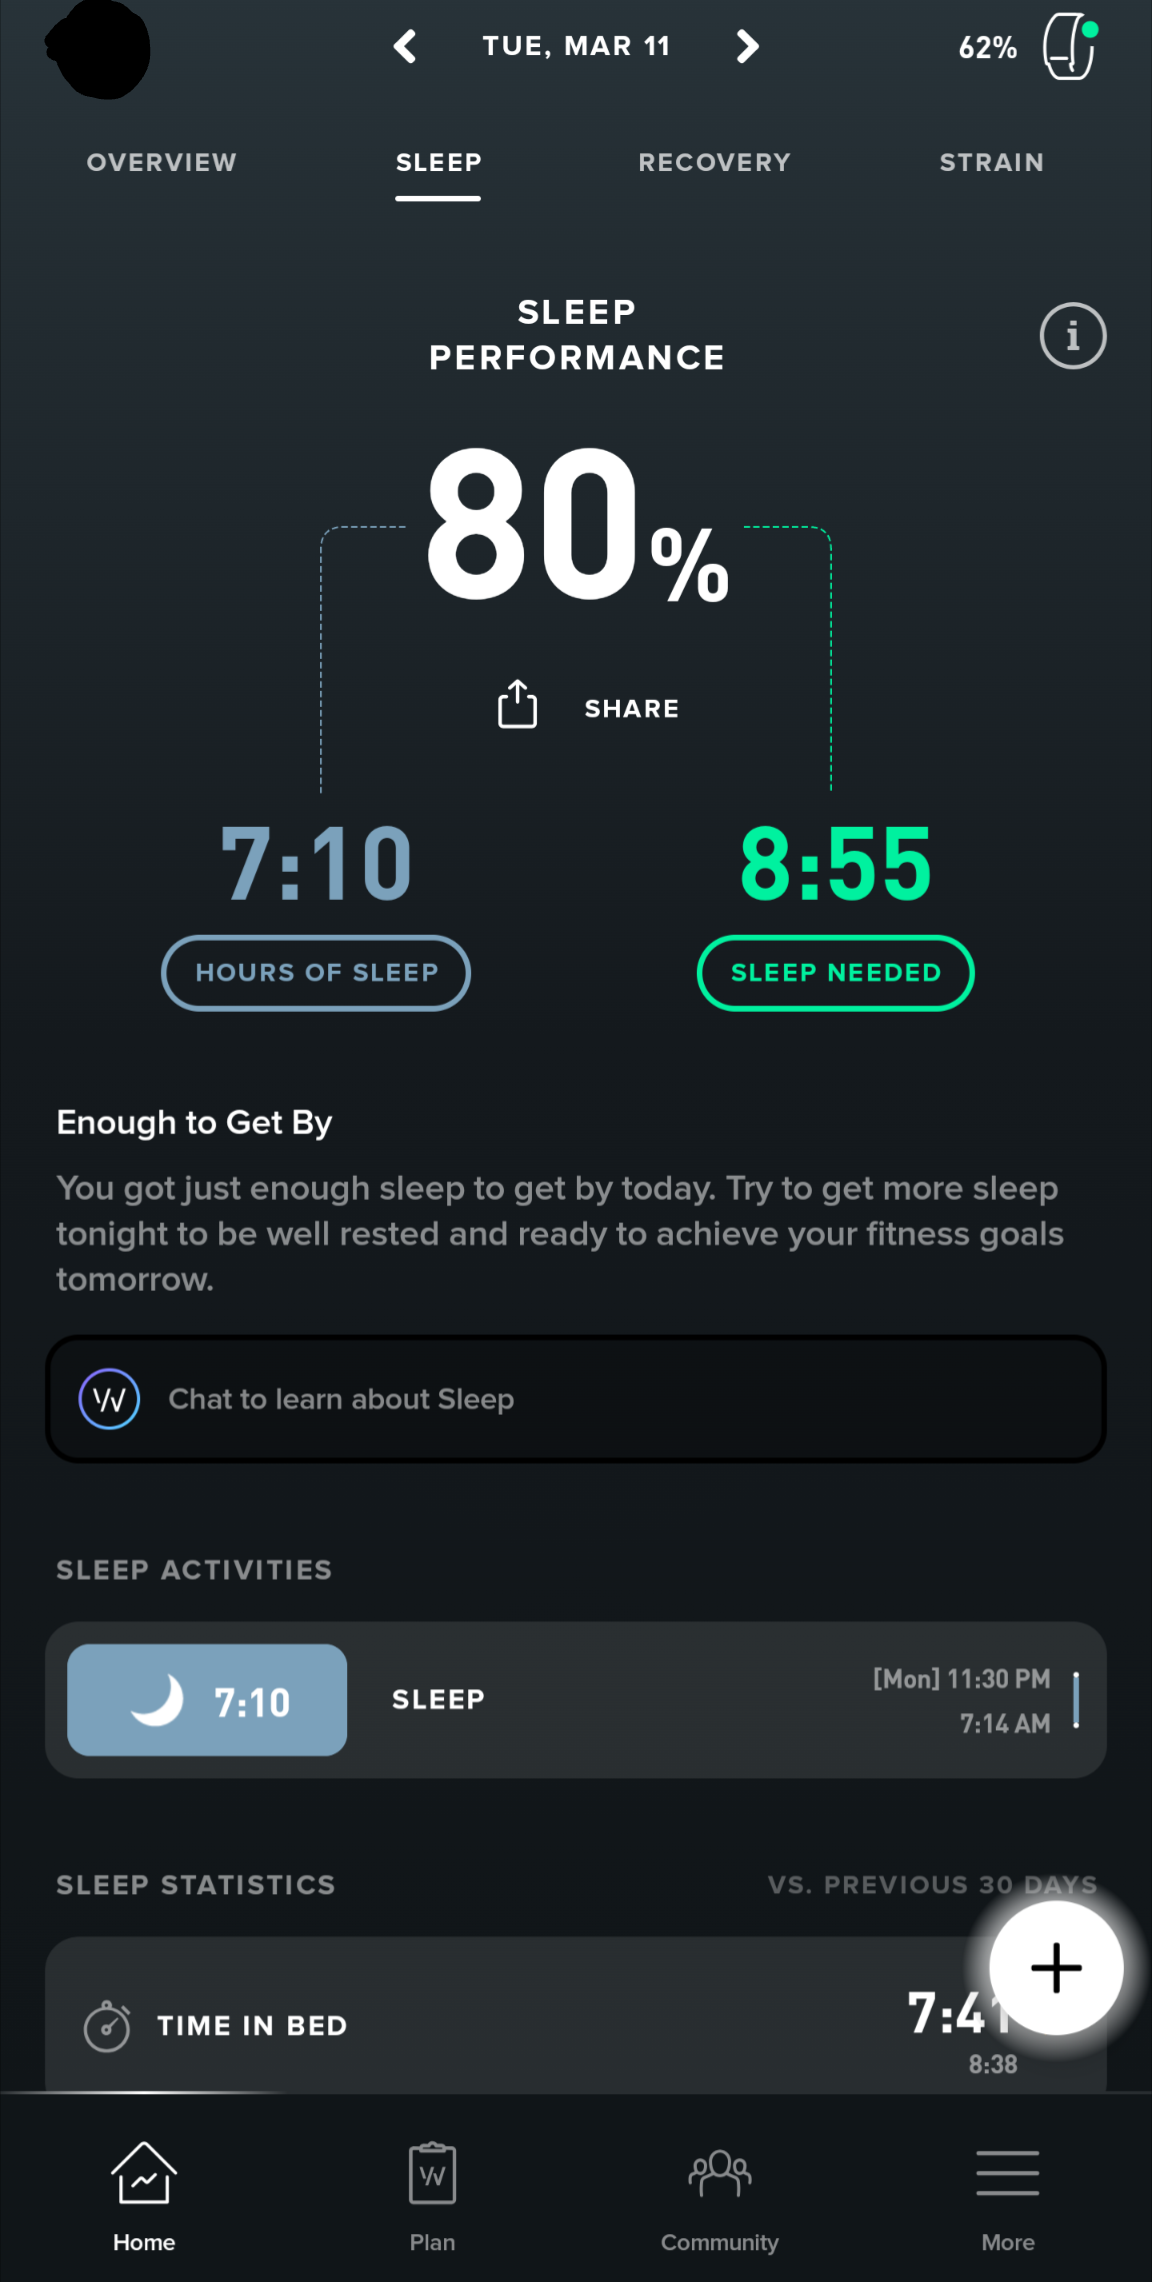
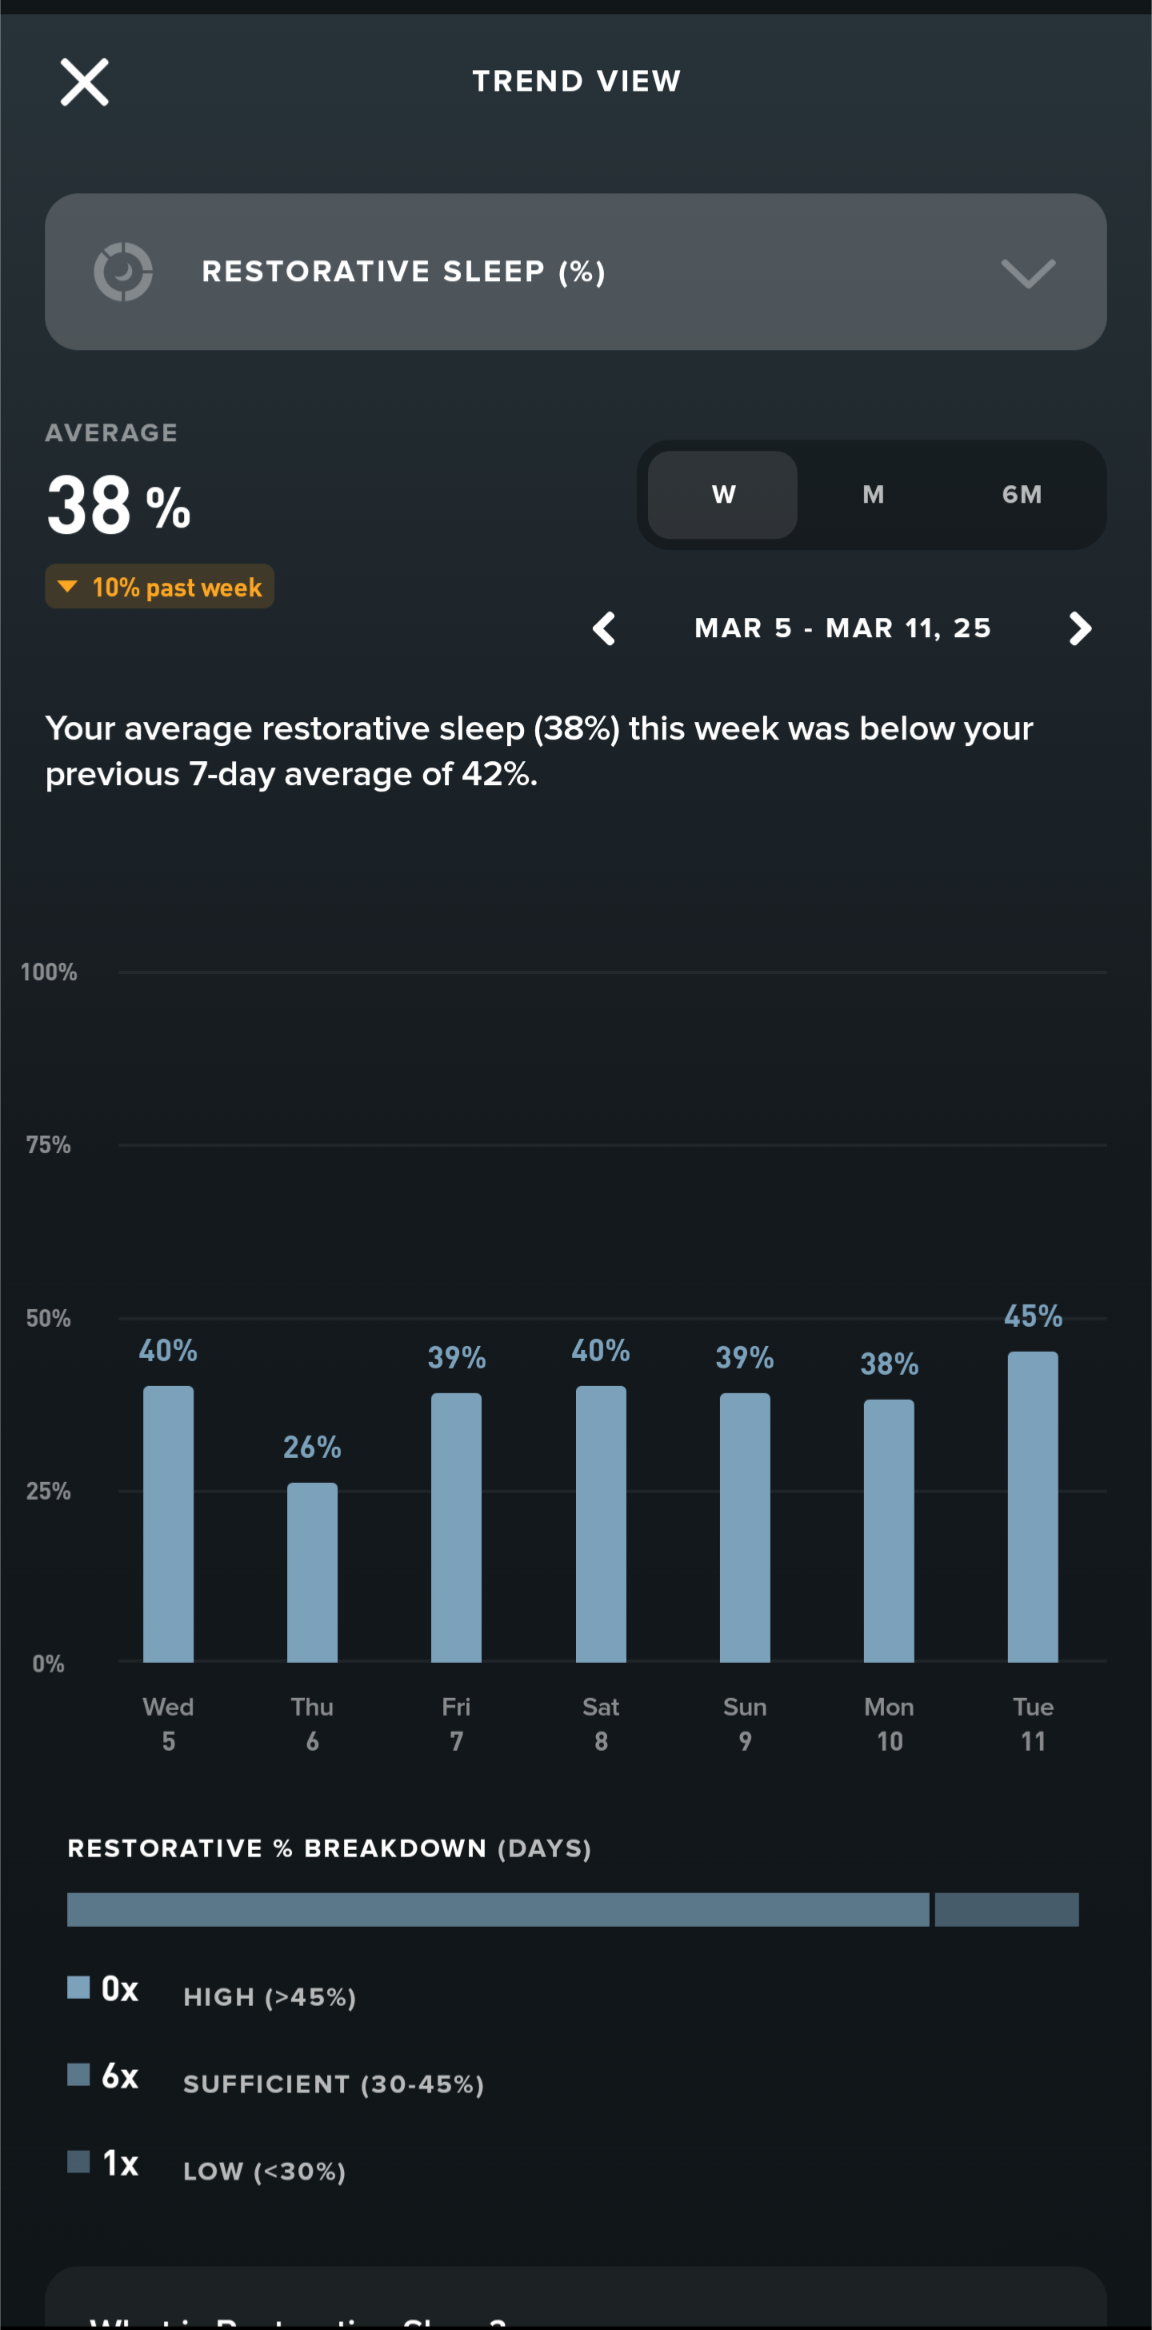
Navigating to the Sleep tab at the top brings you into an overall view of sleep metrics which shows sleep performance percentage, sleep activities, and all of the associated sleep statistics, which are able to be opened and viewed in a more fine-grained statistical visualization. The trend view selections are the same trend views that are located on the home page., but these are filtered specifically for sleep.
Sleep performance is calculated by the amount of sleep you got, divided by how much sleep you need. The aim is to meet 70% of your sleep need to get by, 85% to perform, and 100% of your sleep need for peak performance (those three goals are adjustable based on user preference)
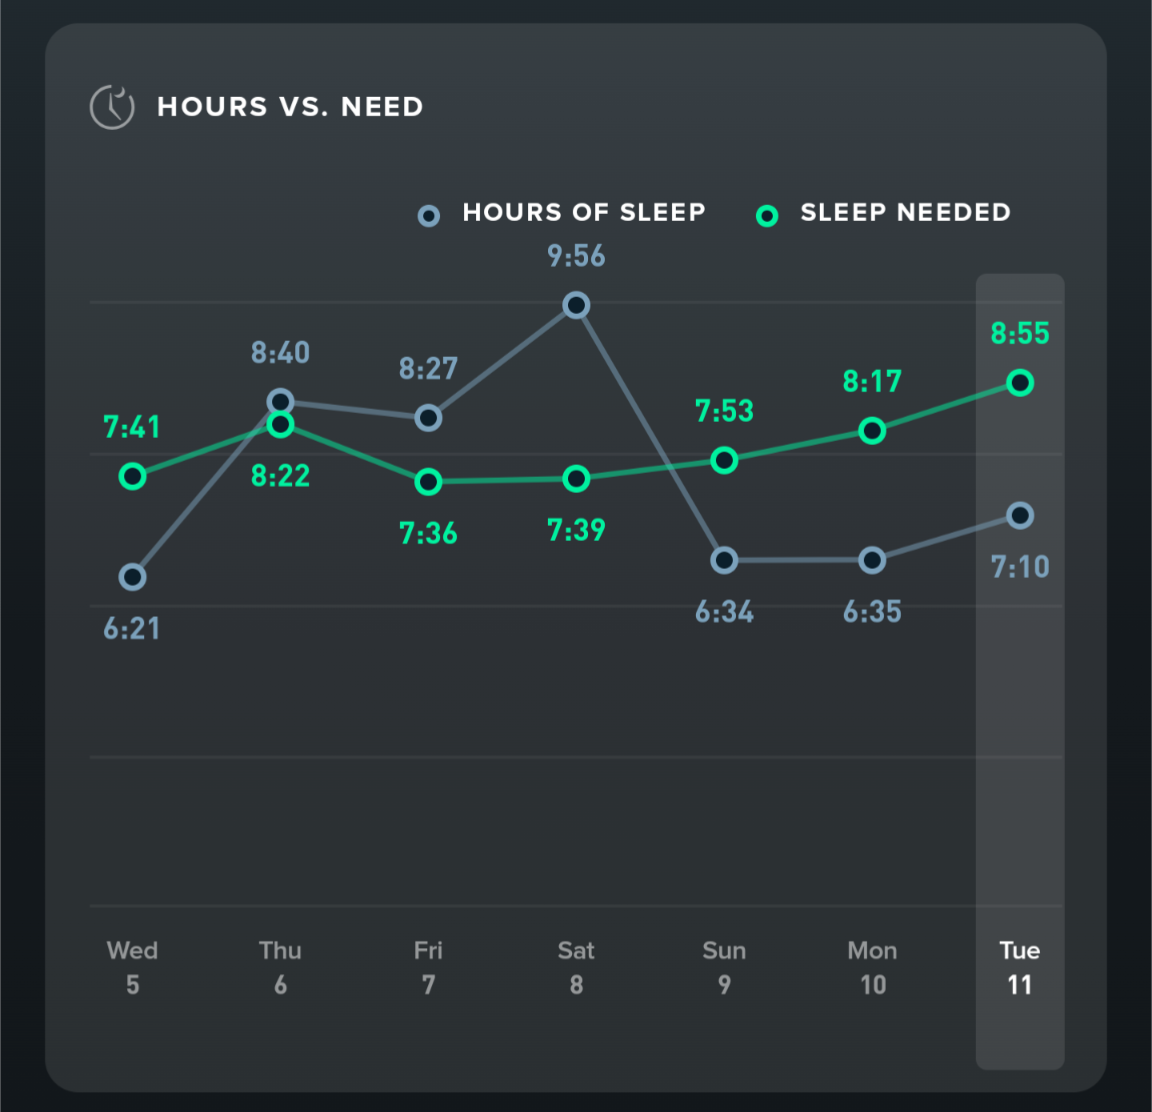
This shows how many hours of sleep you got compared to how many you needed. Sleep need is calculated each day based on your personalized baseline, sleep debt, strain, and naps taken. It measures how much sleep you need to hit peak performance.
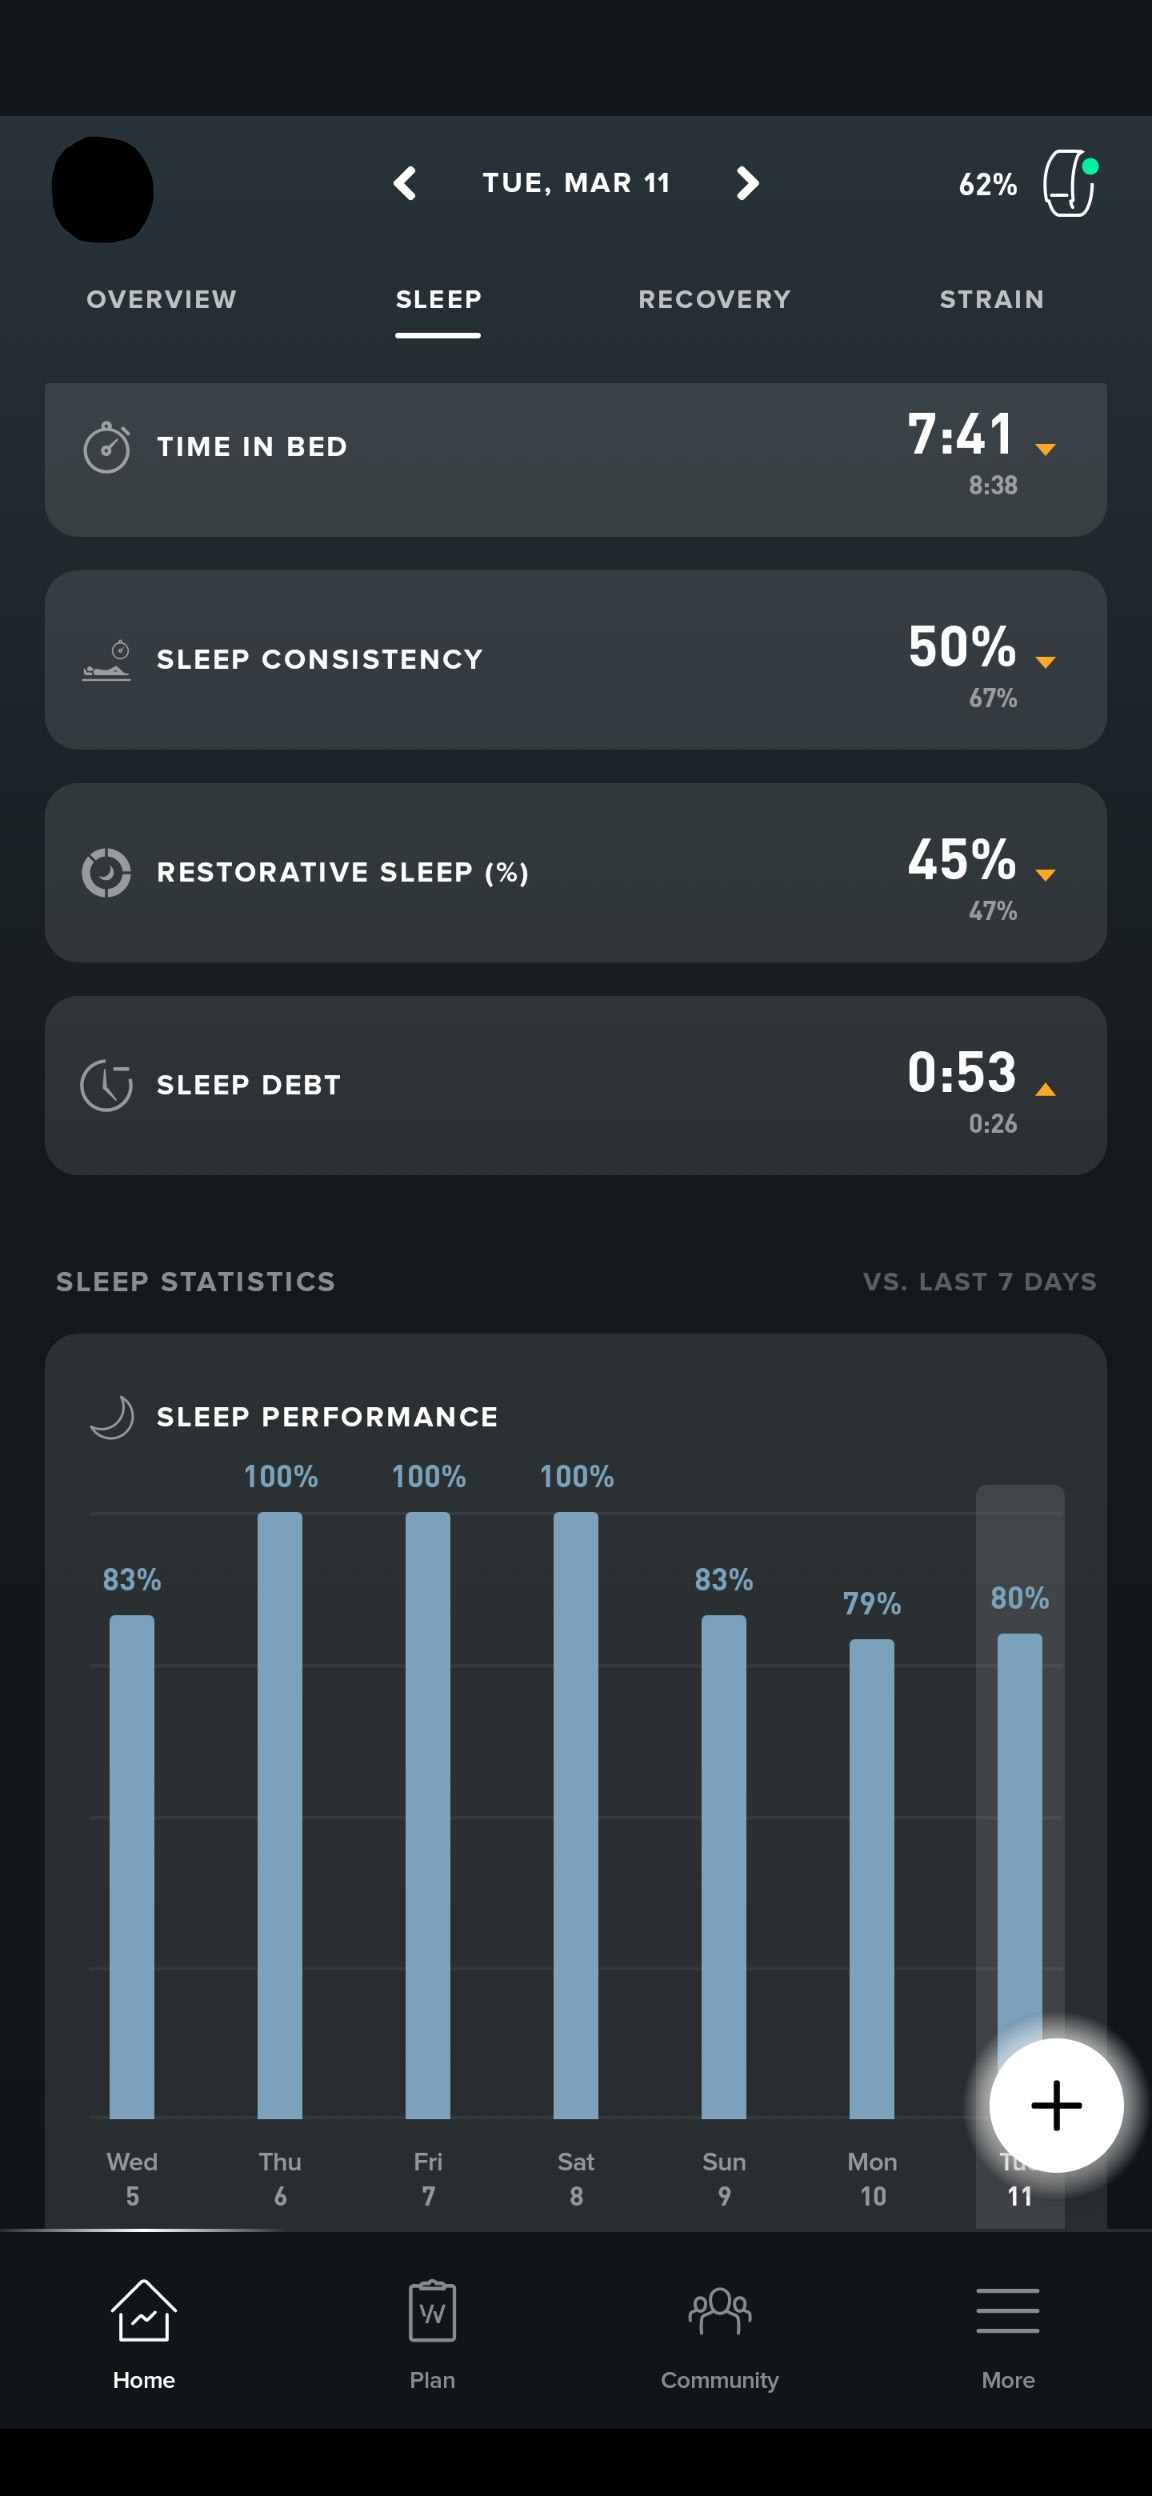
This measures the amount of time between getting into bed and getting out of bed after the sensor recognizes that you are awake. It also takes into account latency, which is the time it takes to fall asleep, and cumulative time awake at night.
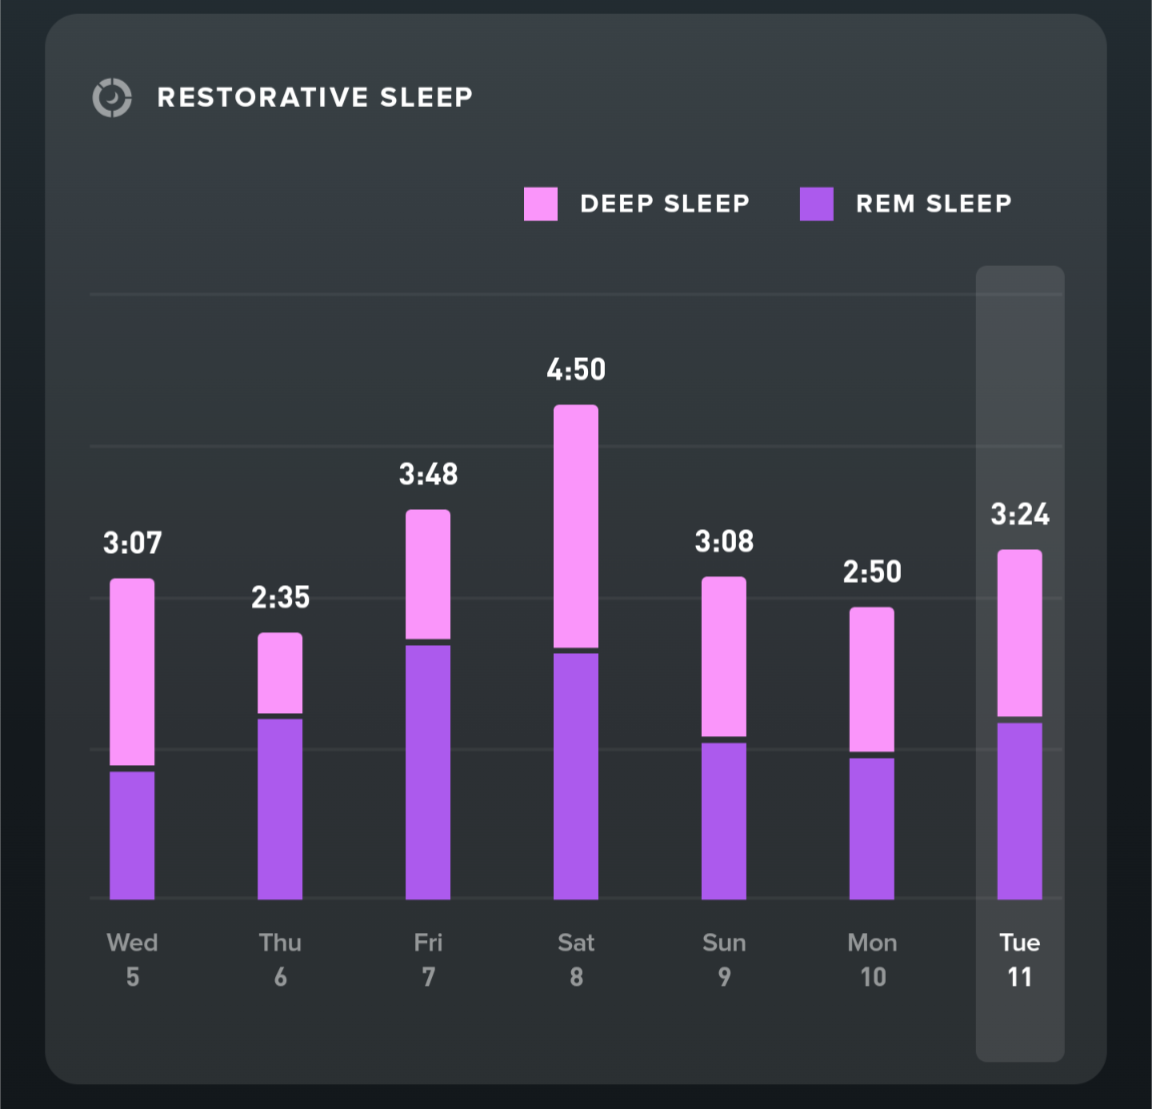
Reflects how many hours you spend in the Deep (sws) and rem stages of sleep each night. Deep sleep is the physically restorative stage and rem sleep is the mentally restorative stage where most dreams occur and short-term memories are converted into long-term memories.
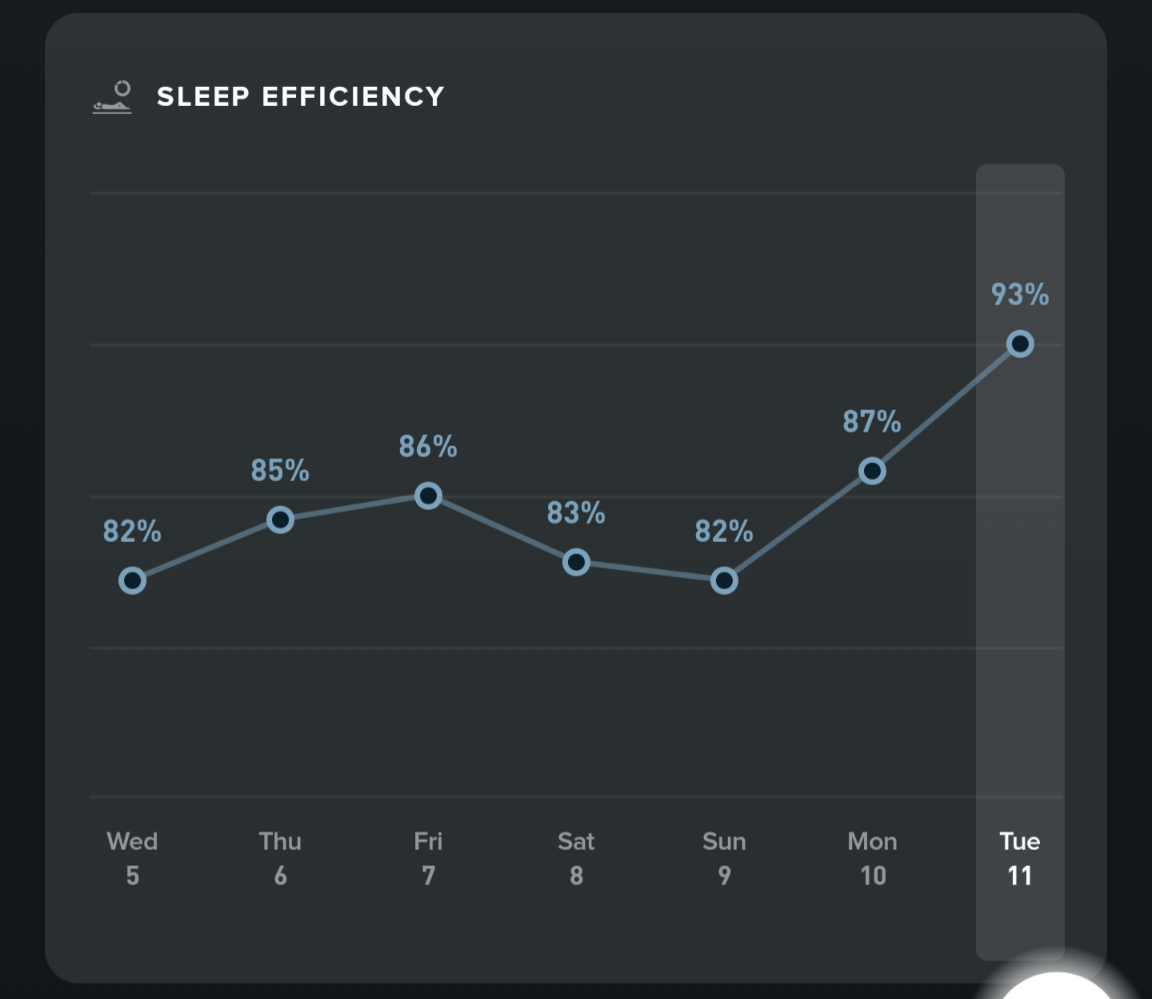
The percentage of time you spend in bed actually asleep. To calculate, divide the time spent sleeping by the total time you spent in bed, then multiply by 100. The ratio is scored on a 0–100% scale.
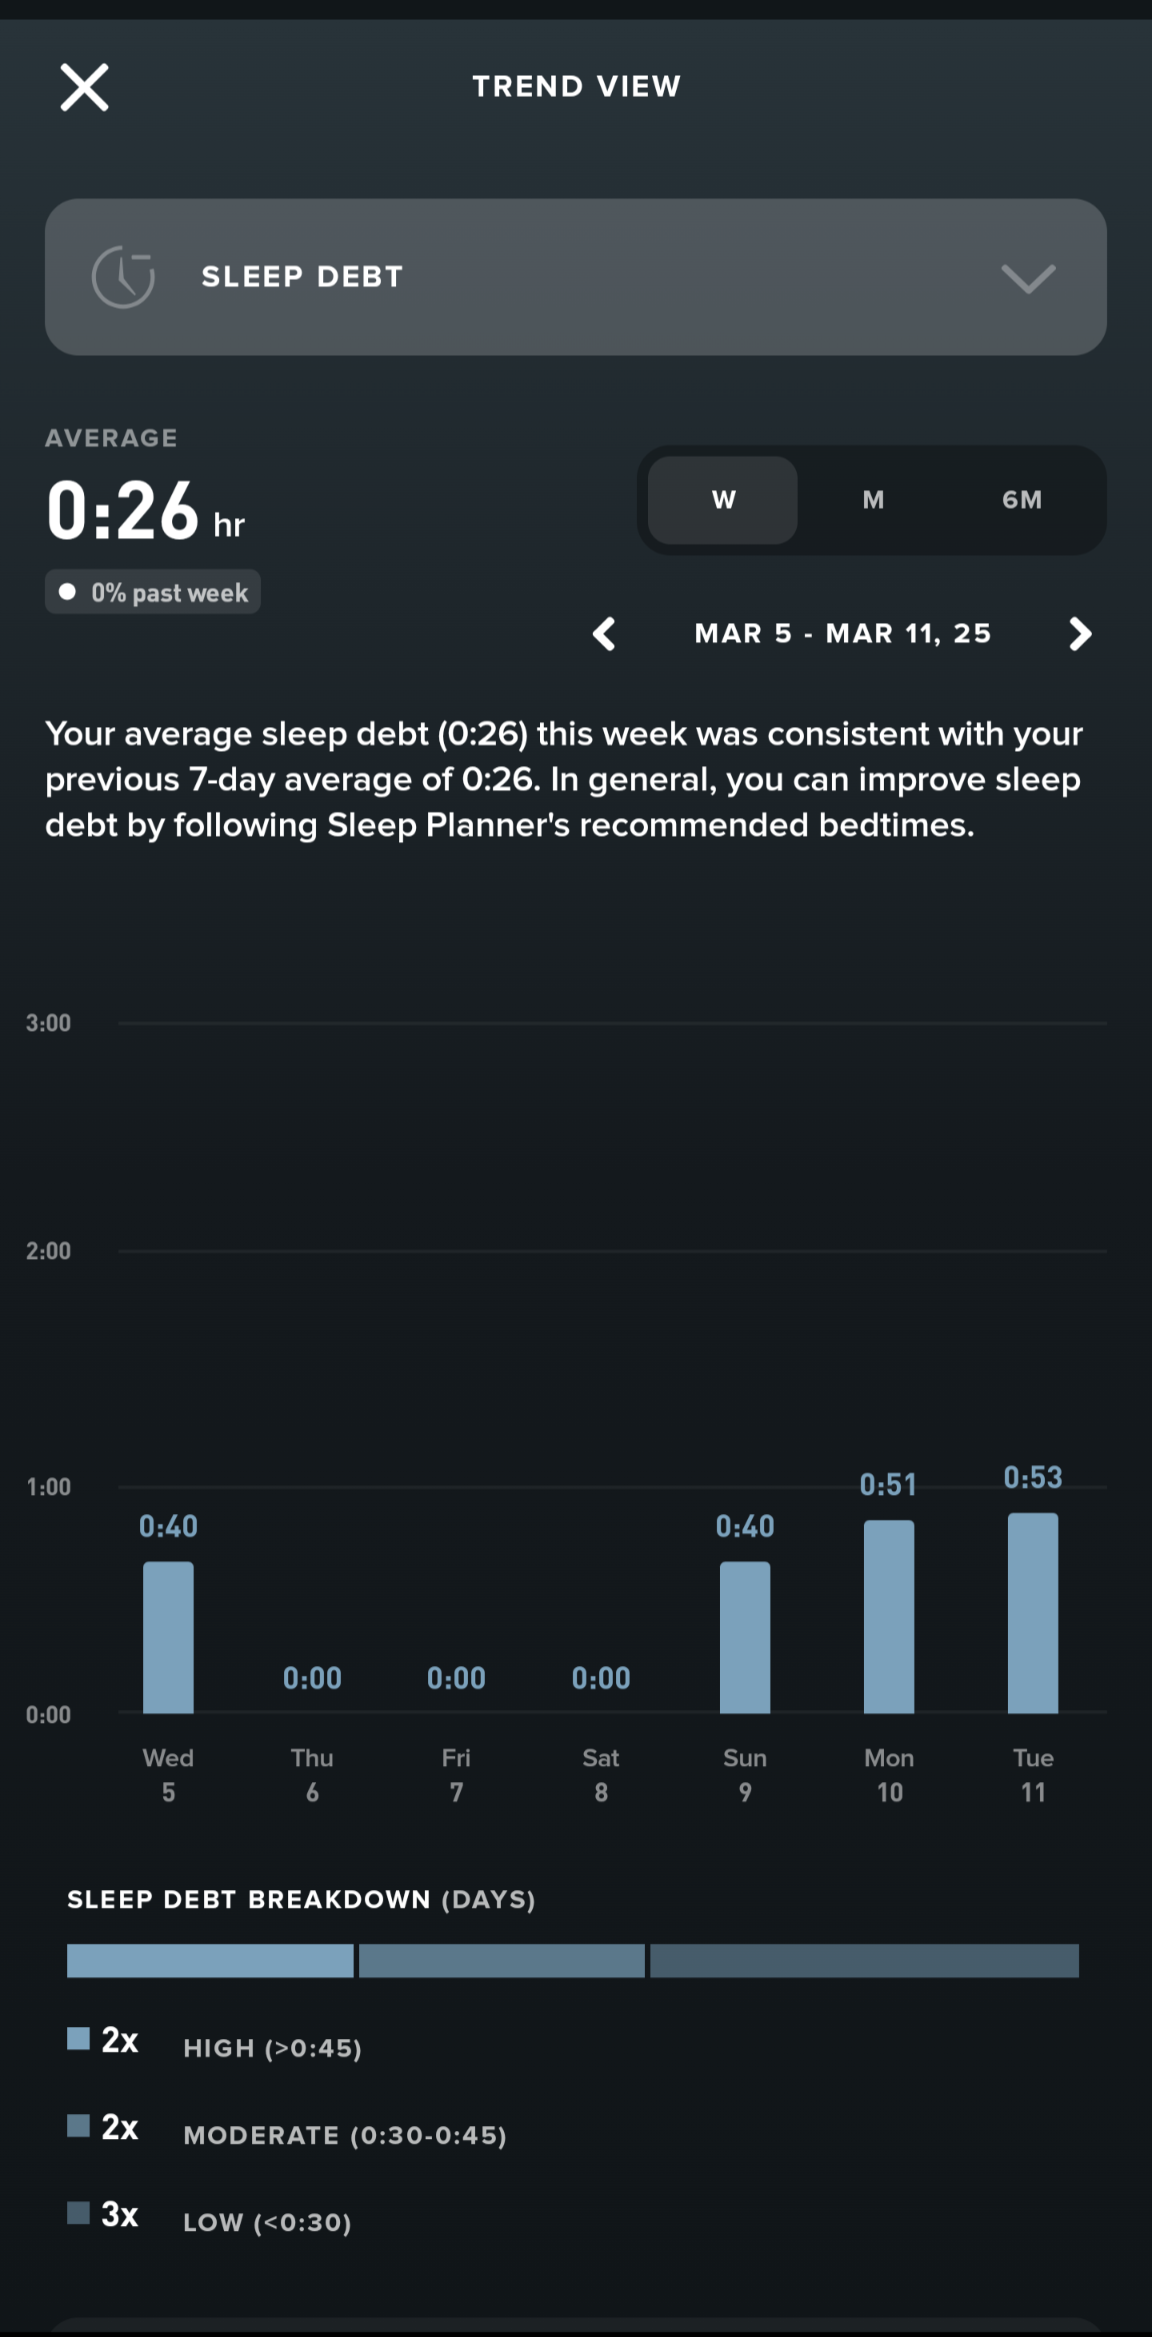
The accumulated loss of sleep that occurs when you don’t get enough sleep on a regular basis. You measure this by the difference between the calcualted amount of sleeep you need and the amount you actually get (which are shown in the main sleep event metrics).
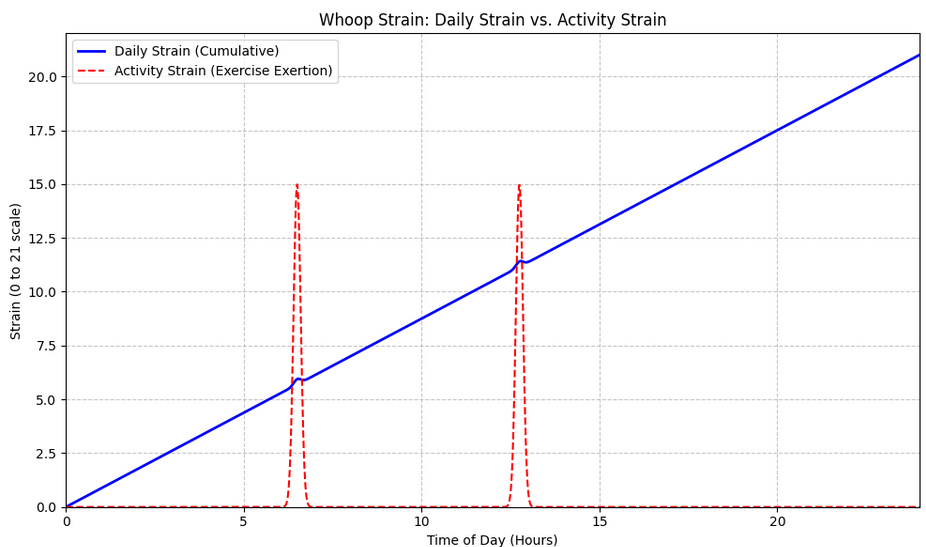
This metric refers to the exertion you put on your body throughout the day, which is Day Strain. It measures all strain accumulated over an entire day plus the calculated strain of recorded activities. Even without recording any activities, you can build up strain passively as you move through the day. Right now, strain is broken down between cardiovascular and muscular load. So, if you record an activity, you can manually enter the exercises you completed during said activity, and the app will calculate the load of those movements into your workout, which will also contribute to the overall Day Strain. But, since strain is logarithmic, not linear, measured strain of individual activities won’t add up to the total Day Strain. Instead, the higher your Strain gets, the harder it is to build more.
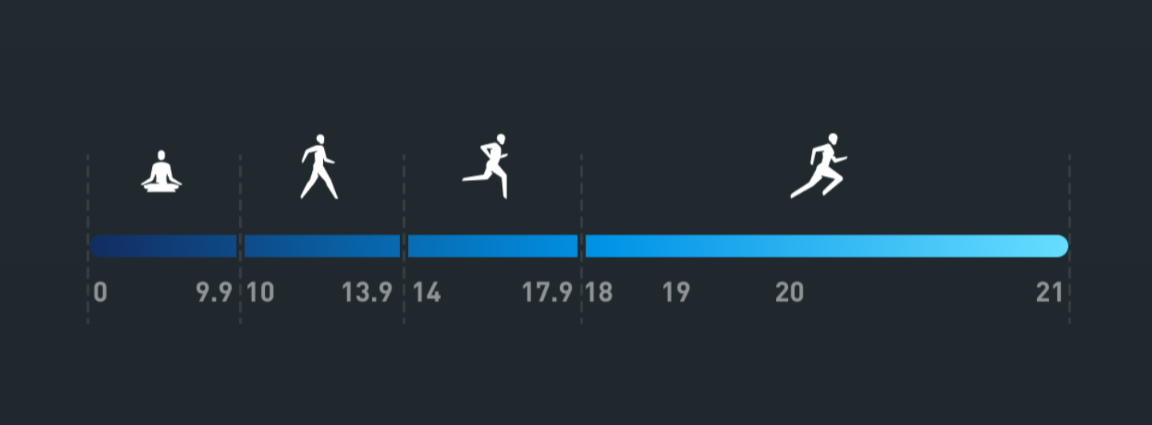
Strain is measured on a scale from 0 to 21:
Light (0–9)
Minimal exertion is being put on the body, which encourages active recovery.
Moderate (10–13)
Moderate exertion is being put on the body, which balances fitness gains and recovery.
High (14–17)
Increased exertion which builds fitness gains, but makes it more difficult for your body to recover the next day.
All Out (18–21)
Significant exertion which increases fitness gains, but puts your body at greater risk for injury or overtraining.
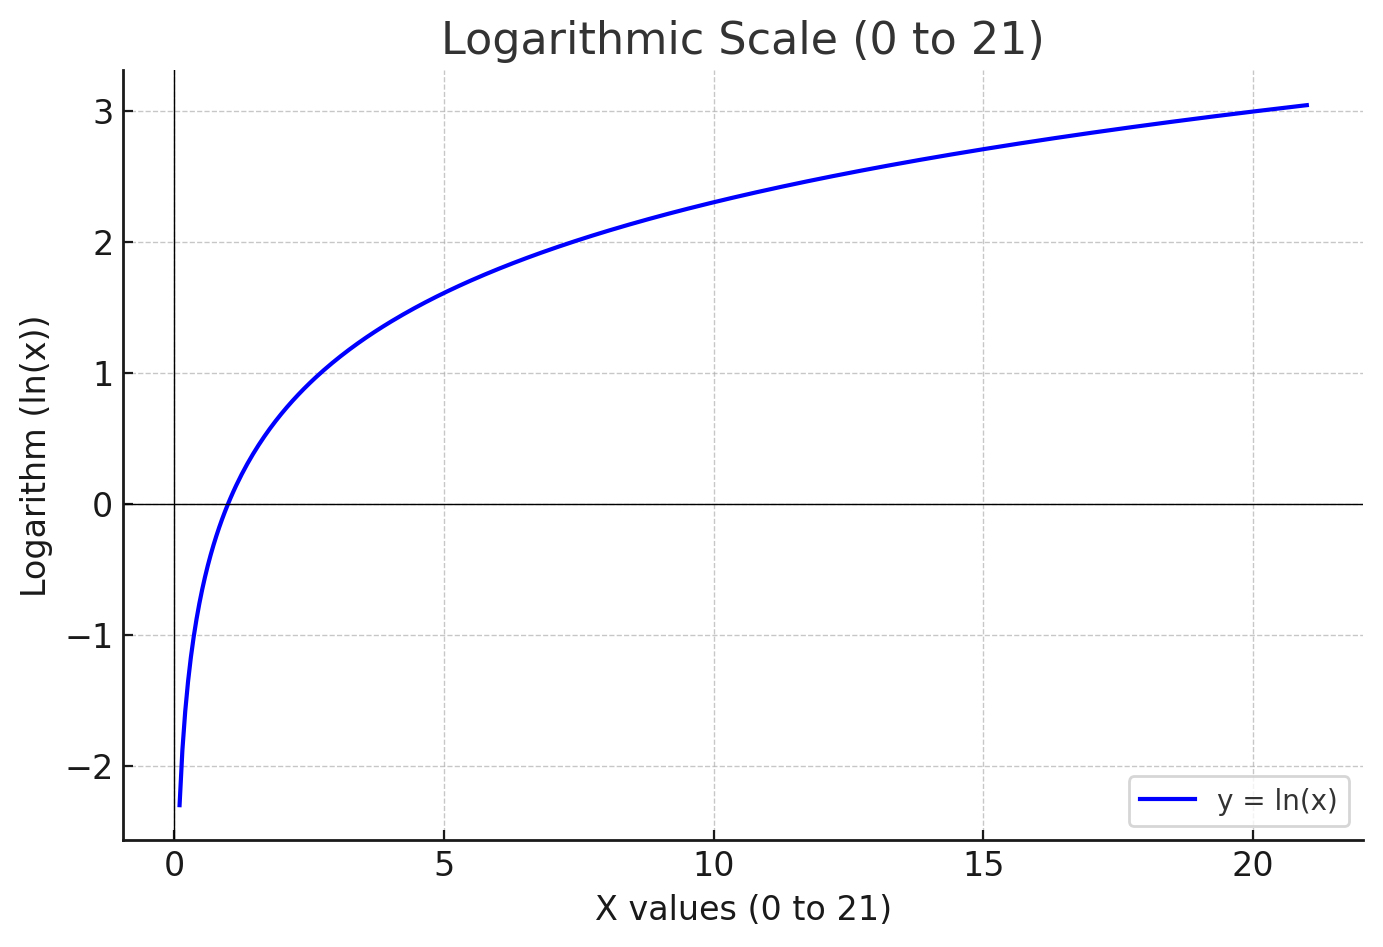
→ The Strain metric is reported using a 0–21 log scale:
graph showing the natural logarithm (ln) of values from 0.1 to 21. Since log scales can’t include zero, I started from a small positive number
Now, let’s set up a generic representation of the scale with matplotlib:
# Generate x values from a small positive number to 21 (log scale can't include zero)x = np.linspace(0.1, 21, 400)y = np.log(x) # Natural logarithm# Create the plotplt.figure(figsize=(8, 5))plt.plot(x, y, label="y = ln(x)", color="blue")plt.xlabel("X values (0 to 21)")plt.ylabel("Logarithm (ln(x))")plt.title("Logarithmic Scale (0 to 21)")plt.axhline(0, color='black', linewidth=0.5)plt.axvline(0, color='black', linewidth=0.5)plt.grid(True, which='both', linestyle='--', linewidth=0.5)plt.legend()# Show the plotplt.show()
Now, in Jupyter Notebook, with more context added, we create an example of how strain would be measured in a day (activities included):
import numpy as npimport matplotlib.pyplot as plt# Create a time vector for a day in minutest = np.linspace(0, 24, 24*60) # <span style="font-variant-numeric: lining-nums;">24</span> hours in minutes (converted to hours)# Baseline daily strain accumulation (e.g., constant accumulation across the day) baseline_rate = 21 / 24 # if it were linear, accumulate to 21 by midnight daily_strain = baseline_rate * t# Simulate exercise periods with additional strain contribution# Define exercise periods (in hours)exercise_periods = [(7.5, 8.0), (12.0, 12.5), (18.0, 18.5)]exercise_contrib = np.zeros_like(t)# For activity strain, we'll simulate peaks only during exercise periodsactivity_strain = np.zeros_like(t)for start, end in exercise_periods: # Create a Gaussian bump centered in the middle of the exercise period center = (start + end) / 2 width = 0.1 # controls duration of the spike # Gaussian function for exercise spike (activity strain) spike = 15 * np.exp(-((t - center)**2) / (2 * width**2)) # Add the spike to the activity strain curve activity_strain += spike # Also add a portion of the spike to daily strain accumulation # Here we assume that the exercise contributes to daily strain, but in a cumulative way daily_strain += spike * (t[1] - t[0]) # integrate spike contribution# Ensure daily strain does not exceed 21 (simulate Whoop's max daily strain)daily_strain = np.clip(daily_strain, 0, 21)# Plottingplt.figure(figsize=(10, 6))plt.plot(t, daily_strain, label="Daily Strain (Cumulative)", color="blue", linewidth=2)plt.plot(t, activity_strain, label="Activity Strain (Exercise Exertion)", color="red", linestyle='--')plt.xlabel("Time of Day (Hours)")plt.ylabel("Strain (0 to 21 scale)")plt.title("Whoop Strain: Daily Strain vs. Activity Strain")plt.xlim(0, 24)plt.ylim(0, 22)plt.grid(True, linestyle="--", alpha=0.7)plt.legend()plt.tight_layout()plt.show()

 upfront costs are 239. There is also a monthly subscription, which is 360/yr), which is the plan I am currently on. It would make sense to shift over to at least the yearly, but it seems that I am not thrilled about the idea of receiving a $240 bill at the beginning of each year. Upon initial order, their standard band is included, which is what I chose. (Note: the membership is hsa / fsa eligible, which I did not know until very recently)
 and skin temperature. Whoop boasts that they built the first product in the world to be powered by Sila’s
 silicon-anode
 chemistry, which allows for a smaller form factor battery with a 17% higher energy density.
 hrv,
hrv, (immersion beyond 1 meter) for dust proofness and water resistance.
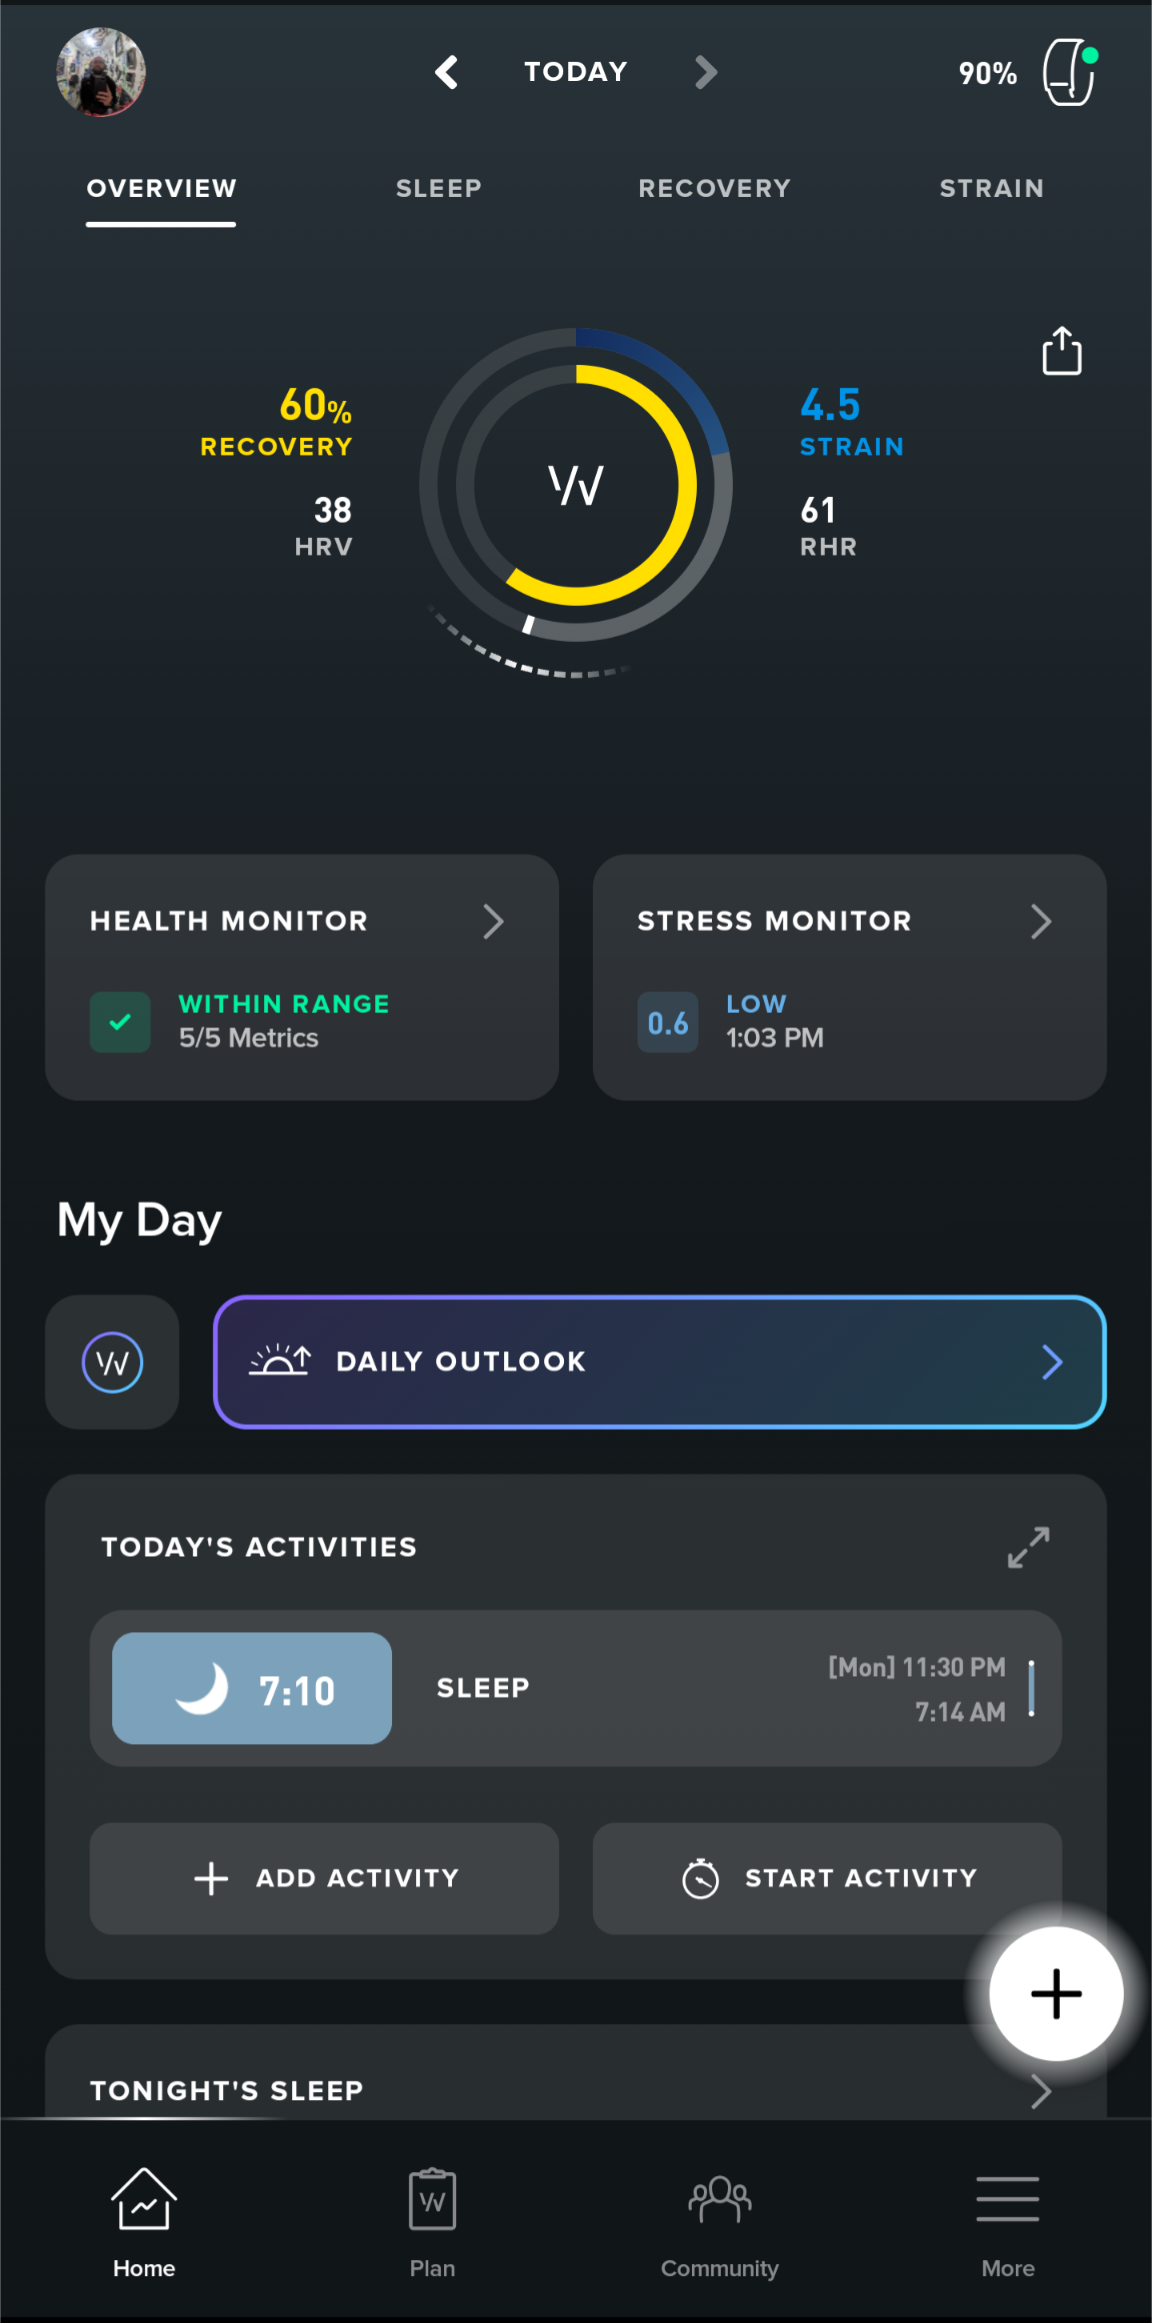

.png) ༺
༺ & rss
& rss
